


Collect the data you need and turn it into actionable insights.
Explore our online survey-based diagnostics for executives and tech leaders.
- Identify critical gaps and drive strategic improvements.
- We'll guide you from selection to preparation to review.
- Contact us and learn how to get started.

Explore Our Diagnostic Surveys

60%
of CIOs and CEOs do not align on their understanding of IT's target role.
Building an IT strategy and unsure of your CEO's perspective? This diagnostic survey helps you understand their view on IT's role and prioritize key issues. Create an improvement roadmap to bridge gaps and build trust.
- Invest in technologies that suit business needs.
- Address gaps by understanding the differences between you and your CEO.
- Deliver results in a way that allows your CEO to recognize IT process.
Participants
CEO, CIO or equivalent
Time to Complete
15-20 minutes
Members' Measured Impact
9.4 / 10
Overall Satisfaction
$23.4K
Budget Saved
19.5
Business Days Saved
9.4 / 10
Satisfaction
$23.4K
Budget Saved
19.5
Days Saved
CEO-CIO Alignment
Satisfy your most important stakeholder - the CEO.
60%
of CIOs and CEOs do not align on their understanding of IT's target role.
Building an IT strategy and unsure of your CEO's perspective? This diagnostic survey helps you understand their view on IT's role and prioritize key issues. Create an improvement roadmap to bridge gaps and build trust.
- Invest in technologies that suit business needs.
- Address gaps by understanding the differences between you and your CEO.
- Deliver results in a way that allows your CEO to recognize IT process.
Participants
CEO, CIO or equivalent
Time to Complete
15-20 minutes
Members' Measured Impact
9.4 / 10
Overall Satisfaction
$23.4K
Budget Saved
19.5
Business Days Saved
9.4 / 10
Satisfaction
$23.4K
Budget Saved
19.5
Days Saved

18%
of organizations have stakeholders who are satisfied with IT.
New to your organization or building an IT strategy with competing demands? This diagnostic survey helps you understand stakeholder priorities and create department scorecards. Measure IT effectiveness and benchmark against industry peers.
- Highlight the business impact of IT constraints.
- Prioritize key services and create an improvement roadmap.
- Manage critical stakeholders by building action plans.
Participants
Business leaders, manager, and above
Time to Complete
15-20 minutes
Members' Measured Impact
9.5 / 10
Overall Satisfaction
$26.4K
Budget Saved
15.9
Business Days Saved
9.5 / 10
Satisfaction
$26.4K
Budget Saved
15.9
Days Saved
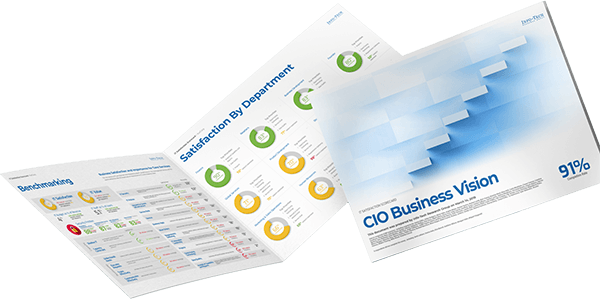
CIO Business Vision
Measure IT satisfaction to prioritize what matters most.
18%
of organizations have stakeholders who are satisfied with IT.
New to your organization or building an IT strategy with competing demands? This diagnostic survey helps you understand stakeholder priorities and create department scorecards. Measure IT effectiveness and benchmark against industry peers.
- Highlight the business impact of IT constraints.
- Prioritize key services and create an improvement roadmap.
- Manage critical stakeholders by building action plans.
Participants
Business leaders, manager, and above
Time to Complete
15-20 minutes
Members' Measured Impact
9.5 / 10
Overall Satisfaction
$26.4K
Budget Saved
15.9
Business Days Saved
9.5 / 10
Satisfaction
$26.4K
Budget Saved
15.9
Days Saved

35%
of organizations are effective across their entire process landscape.
Looking to understand and improve your key IT processes? This diagnostic survey helps you prioritize processes and pinpoint areas for improvement. Build a process improvement roadmap to enhance IT's effectiveness and deliver exceptional business value.
- Leverage a comprehensive framework for improving core IT processes.
- Receive a custom set of tools and research materials for each process.
- Manage ownership for improvement initiatives and implementation.
Participants
Managers and above within IT
Time to Complete
15-20 minutes
Members' Measured Impact
9.3 / 10
Overall Satisfaction
$16.6K
Budget Saved
13.6
Business Days Saved
9.3 / 10
Satisfaction
$16.6K
Budget Saved
13.6
Days Saved
IT Management & Governance
Assess the effectiveness of your core IT processes.
35%
of organizations are effective across their entire process landscape.
Looking to understand and improve your key IT processes? This diagnostic survey helps you prioritize processes and pinpoint areas for improvement. Build a process improvement roadmap to enhance IT's effectiveness and deliver exceptional business value.
- Leverage a comprehensive framework for improving core IT processes.
- Receive a custom set of tools and research materials for each process.
- Manage ownership for improvement initiatives and implementation.
Participants
Managers and above within IT
Time to Complete
15-20 minutes
Members' Measured Impact
9.3 / 10
Overall Satisfaction
$16.6K
Budget Saved
13.6
Business Days Saved
9.3 / 10
Satisfaction
$16.6K
Budget Saved
13.6
Days Saved

65%
of IT staff time is spent on administrative and maintenance activities.
Need to assess or justify staffing and struggling to support key priorities effectively?This diagnostic survey provides you key staffing metrics to justify IT's headcount and allocate IT's time to focus on higher-value areas based on structured feedback from IT stakeholders.
- Demonstrate the relationship between staffing levels and IT performance.
- Engage your team to improve IT across seven drivers of effectiveness.
- Evaluate resource time spent on high-value versus low-value activities.
Participants
All IT personnel, including the CIO
Time to Complete
15 minutes
Members' Measured Impact
9.3 / 10
Overall Satisfaction
$30.9K
Budget Saved
12.5
Business Days Saved
9.3 / 10
Satisfaction
$30.9K
Budget Saved
12.5
Days Saved
IT Staffing Assessment
Improve your ability to grow, manage, and deploy your team.
65%
of IT staff time is spent on administrative and maintenance activities.
Need to assess or justify staffing and struggling to support key priorities effectively?This diagnostic survey provides you key staffing metrics to justify IT's headcount and allocate IT's time to focus on higher-value areas based on structured feedback from IT stakeholders.
- Demonstrate the relationship between staffing levels and IT performance.
- Engage your team to improve IT across seven drivers of effectiveness.
- Evaluate resource time spent on high-value versus low-value activities.
Participants
All IT personnel, including the CIO
Time to Complete
15 minutes
Members' Measured Impact
9.3 / 10
Overall Satisfaction
$30.9K
Budget Saved
12.5
Business Days Saved
9.3 / 10
Satisfaction
$30.9K
Budget Saved
12.5
Days Saved

48%
of applications are actually effective.
Do your applications support the teams that depend on them? This diagnostic survey offers a 360-degree assessment of your application portfolio's effectiveness and health. Drive more value from effective applications and promptly address at-risk ones.
- Understand end-user sentiment toward the software you support.
- Decide which apps to retire, upgrade, or maintain.
- Create an internal annual benchmark.
Participants
End users, frontline employees to executives
Time to Complete
10-15 minutes
Members' Measured Impact
9.5 / 10
Overall Satisfaction
$14.4K
Budget Saved
10.6
Business Days Saved
9.5 / 10
Satisfaction
$14.4K
Budget Saved
10.6
Days Saved
Application Portfolio Assessment
Find out what users really think of IT's business applications.
48%
of applications are actually effective.
Do your applications support the teams that depend on them? This diagnostic survey offers a 360-degree assessment of your application portfolio's effectiveness and health. Drive more value from effective applications and promptly address at-risk ones.
- Understand end-user sentiment toward the software you support.
- Decide which apps to retire, upgrade, or maintain.
- Create an internal annual benchmark.
Participants
End users, frontline employees to executives
Time to Complete
10-15 minutes
Members' Measured Impact
9.5 / 10
Overall Satisfaction
$14.4K
Budget Saved
10.6
Business Days Saved
9.5 / 10
Satisfaction
$14.4K
Budget Saved
10.6
Days Saved

25%
of organizations are confident in their data quality.
Experiencing data quality issues in your applications? This diagnostic survey assesses data quality across nine dimensions, identifying error-prone fields and necessary training. Ensure your data meets business needs effectively.
- Identify and address data quality issues.
- Improve your data quality score from the CIO Business Vision diagnostic.
- Uncover business users who need help with data.
Participants
Stakeholders who use the relevant application
Time to Complete
5-10 minutes
Members' Measured Impact
9.5 / 10
Overall Satisfaction
$11.9K
Budget Saved
16.7
Business Days Saved
9.5 / 10
Satisfaction
$11.9K
Budget Saved
16.7
Days Saved
Data Quality
Ensure reliable data to drive successful business results.
25%
of organizations are confident in their data quality.
Experiencing data quality issues in your applications? This diagnostic survey assesses data quality across nine dimensions, identifying error-prone fields and necessary training. Ensure your data meets business needs effectively.
- Identify and address data quality issues.
- Improve your data quality score from the CIO Business Vision diagnostic.
- Uncover business users who need help with data.
Participants
Stakeholders who use the relevant application
Time to Complete
5-10 minutes
Members' Measured Impact
9.5 / 10
Overall Satisfaction
$11.9K
Budget Saved
16.7
Business Days Saved
9.5 / 10
Satisfaction
$11.9K
Budget Saved
16.7
Days Saved

of IT departments are stuck in instability or firefighter mode.
Are you ready to lead your organization through the next phase of technology-driven transformation? IT leaders have a crucial opportunity during this period. This diagnostic survey ensures your organization does not miss out on valuable opportunities.
- Unpack organizational expectations for transformation
- Identify an effective course of action to meet expectations
- Better understand where to prioritize efforts
Participants
IT department
Time to Complete
15-20 minutes
Members' Measured Impact
9.2/10
Overall Satisfaction
$8.4K
Budget Saved
4.6
Business Days Saved
9.2/10
Satisfaction
$8.4K
Budget Saved
4.6
Days Saved
Exponential IT Readiness
Start your exponential IT journey here.
of IT departments are stuck in instability or firefighter mode.
Are you ready to lead your organization through the next phase of technology-driven transformation? IT leaders have a crucial opportunity during this period. This diagnostic survey ensures your organization does not miss out on valuable opportunities.
- Unpack organizational expectations for transformation
- Identify an effective course of action to meet expectations
- Better understand where to prioritize efforts
Participants
IT department
Time to Complete
15-20 minutes
Members' Measured Impact
9.2/10
Overall Satisfaction
$8.4K
Budget Saved
4.6
Business Days Saved
9.2/10
Satisfaction
$8.4K
Budget Saved
4.6
Days Saved

23%
of organizations have end users who are satisfied with IT.
Are you enabling the business or struggling to support key priorities? This diagnostic survey helps you improve IT's reputation by receiving structured feedback from end users to pinpoint successes and areas for improvement that provides high impact.
- Measure satisfaction with IT performance
- Evaluate IT's core services capabilities
- Build and support an ongoing IT strategy
Participants
End users, frontline employees to executives
Time to Complete
5-10 minutes
Members' Measured Impact
9.5/10
Overall Satisfaction
$14.6K
Budget Saved
8.5
Business Days Saved
9.5/10
Satisfaction
$14.6K
Budget Saved
8.5
Days Saved
End-User Satisfaction
Find out what users really think of IT services.
23%
of organizations have end users who are satisfied with IT.
Are you enabling the business or struggling to support key priorities? This diagnostic survey helps you improve IT's reputation by receiving structured feedback from end users to pinpoint successes and areas for improvement that provides high impact.
- Measure satisfaction with IT performance
- Evaluate IT's core services capabilities
- Build and support an ongoing IT strategy
Participants
End users, frontline employees to executives
Time to Complete
5-10 minutes
Members' Measured Impact
9.5/10
Overall Satisfaction
$14.6K
Budget Saved
8.5
Business Days Saved
9.5/10
Satisfaction
$14.6K
Budget Saved
8.5
Days Saved

32%
of IT staff regularly receive security training.
Concerned about security risks? This diagnostic program helps you assess your current security posture and identify areas for improvement. Build a comprehensive security strategy aligned with business needs.
- Communicate strengths and successes and measure long-term progress.
- Identify areas for improvement and optimization.
- Leverage recommended actions to chart your course to security success.
Participants
Based on surveys chosen
Time to Complete
10-15 minutes
Members' Measured Impact
9.1/10
Overall Satisfaction
$15.8K
Budget Saved
23.6
Business Days Saved
9.1/10
Satisfaction
$15.8K
Budget Saved
23.6
Days Saved
IT Security Program
This diagnostic survey program helps you access your current state, gaps, and prioritize needs with data-driven strategy.
32%
of IT staff regularly receive security training.
Concerned about security risks? This diagnostic program helps you assess your current security posture and identify areas for improvement. Build a comprehensive security strategy aligned with business needs.
- Communicate strengths and successes and measure long-term progress.
- Identify areas for improvement and optimization.
- Leverage recommended actions to chart your course to security success.
Participants
Based on surveys chosen
Time to Complete
10-15 minutes
Members' Measured Impact
9.1/10
Overall Satisfaction
$15.8K
Budget Saved
23.6
Business Days Saved
9.1/10
Satisfaction
$15.8K
Budget Saved
23.6
Days Saved

Looking to boost employee engagement? The McLean Employee Experience Monitor (EXM) gathers key feedback with a single question and up to five customizable ones. Use the dashboard to identify promoters, passives, or detractors and refine your strategy.
- Monitor employee experience monthly to quarterly.
- Provide frequent data to boost manager effectiveness.
- Access data anytime to analyze trends and reactions.
Participants
IT department
Time to Complete
1-5 minutes
McLean Employee Experience Monitor
The McLean Employee Experience Monitor gathers key feedback with a single question and up to five customizable ones.
Looking to boost employee engagement? The McLean Employee Experience Monitor (EXM) gathers key feedback with a single question and up to five customizable ones. Use the dashboard to identify promoters, passives, or detractors and refine your strategy.
- Monitor employee experience monthly to quarterly.
- Provide frequent data to boost manager effectiveness.
- Access data anytime to analyze trends and reactions.
Participants
IT department
Time to Complete
1-5 minutes

How do you measure project success? This diagnostic survey helps you report on your team's success for each completed project by collecting feedback from sponsors, impacted users, and the project team on the real benefits delivered.
- Collect quick project feedback from all stakeholders in under five minutes.
- Use feedback to enhance project delivery and management practices.
- Share IT's business value to boost profile and stakeholder confidence.
Participants
Project team and business sponsors, impacted users
Time to Complete
15-20 minutes
Project Benefits
This diagnostic survey helps you report on project success by collecting stakeholder feedback.
How do you measure project success? This diagnostic survey helps you report on your team's success for each completed project by collecting feedback from sponsors, impacted users, and the project team on the real benefits delivered.
- Collect quick project feedback from all stakeholders in under five minutes.
- Use feedback to enhance project delivery and management practices.
- Share IT's business value to boost profile and stakeholder confidence.
Participants
Project team and business sponsors, impacted users
Time to Complete
15-20 minutes

52%
of project capacity is used productively by the average organization.
Building a PPM strategy and unsure which PMO areas to prioritize? This diagnostic program provides a series of surveys that identify weaknesses and opportunities for improvement, providing an overview and actionable roadmap.
- Understand your current strengths and weaknesses.
- Eliminate waste and increase project throughput.
- Establish appropriate priorities and manage expectations.
Participants
Based on surveys chosen
Time to Complete
15-20 minutes
Members' Measured Impact
9.6/10
Overall Satisfaction
$47.5K
Budget Saved
22.6
Business Days Saved
9.6/10
Satisfaction
$47.5K
Budget Saved
22.6
Days Saved
Project Portfolio Management Program
Collect the data you need to optimize your organizational goals.
52%
of project capacity is used productively by the average organization.
Building a PPM strategy and unsure which PMO areas to prioritize? This diagnostic program provides a series of surveys that identify weaknesses and opportunities for improvement, providing an overview and actionable roadmap.
- Understand your current strengths and weaknesses.
- Eliminate waste and increase project throughput.
- Establish appropriate priorities and manage expectations.
Participants
Based on surveys chosen
Time to Complete
15-20 minutes
Members' Measured Impact
9.6/10
Overall Satisfaction
$47.5K
Budget Saved
22.6
Business Days Saved
9.6/10
Satisfaction
$47.5K
Budget Saved
22.6
Days Saved

68%
of organizations have stakeholders who are satisfied with analytical capabilities.
How well do your current reports and analytics meet business needs? This diagnostic survey assesses satisfaction across ten areas, identifies unmet needs, and provides actionable insights to improve reporting and analytics.
- Assess business leader satisfaction with reporting and analytics across ten areas.
- Address unmet needs for new reports and advanced analytics tools.
- Deliver focused training to maximize value and reduce IT support work.
Participants
Primary users of the reports
Time to Complete
15-20 minutes
Members' Measured Impact
7.3/10
Overall Satisfaction
$34.5K
Budget Saved
9.0
Business Days Saved
7.3/10
Satisfaction
$34.5K
Budget Saved
9.0
Days Saved
Reporting & Analytics
This diagnostic survey helps assess and improve your reporting and analytics capabilities.
68%
of organizations have stakeholders who are satisfied with analytical capabilities.
How well do your current reports and analytics meet business needs? This diagnostic survey assesses satisfaction across ten areas, identifies unmet needs, and provides actionable insights to improve reporting and analytics.
- Assess business leader satisfaction with reporting and analytics across ten areas.
- Address unmet needs for new reports and advanced analytics tools.
- Deliver focused training to maximize value and reduce IT support work.
Participants
Primary users of the reports
Time to Complete
15-20 minutes
Members' Measured Impact
7.3/10
Overall Satisfaction
$34.5K
Budget Saved
9.0
Business Days Saved
7.3/10
Satisfaction
$34.5K
Budget Saved
9.0
Days Saved


Find out how you can get started
We'll help you every step of the way from diagnostic survey preparation to launch.


