Build a Reporting and Analytical Insights Strategy
Deliver actionable business insights by creating a business-aligned reporting and analytics strategy.
- Citizen data science and federated BI/insights teams are commonplace in most organizations.
- This shift toward federated BI underlines the need to revisit your operating model type, establish roles and responsibilities for the reporting & analytical insights practices, and promote communication and alignment with the business.
- Data leaders want to understand the broader BI landscape and drive value within the organization.
Our Advice
Critical Insight
Good insights generation should follow human-centered design practices. Understanding the needs and sentiments of all your customers, internal or external, is the key to creating actionable analytics insights. BI teams, whether centralized or federated, must establish and communicate the services they provide, aimed at delivering or supporting outstanding reporting and analytical insights, with their services regularly measured for effectiveness and for driving for continuous improvement.
Impact and Result
- Drive strategy development by establishing the business context up-front to align the BI team with the most important needs of their business customers and the strategic priorities of the organization.
- Choose your target operating model style based on your existing BI environment and business requirements.
- Assess current BI maturity and determine your future-state BI maturity.
- Revamp or create a BI strategy to update your BI program to make it fit for purpose.

On Demand
Webinar
Build a Reporting and Analytics Strategy
Play WebinarMember Testimonials
After each Info-Tech experience, we ask our members to quantify the real-time savings, monetary impact, and project improvements our research helped them achieve. See our top member experiences for this blueprint and what our clients have to say.
10.0/10
Overall Impact
$60,775
Average $ Saved
33
Average Days Saved
Client
Experience
Impact
$ Saved
Days Saved
East Carolina University
Guided Implementation
10/10
N/A
120
While it’s difficult to quantify the financial impact at this time, Crystal’s support in drafting our data strategy and BI strategy saved us severa... Read More
Circular Materials
Workshop
10/10
$14,500
7
Our facilitator, Crystal Singh, invested a significant amount of time getting to know our company which led to a well-coordinated workshop experien... Read More
Worldnet International
Guided Implementation
10/10
N/A
10
Valuable insights around culture change
BC Energy Regulator
Workshop
10/10
N/A
20
I really enjoyed the flow and logical progression of the sessions. There wasn't much I didn't like, although I will say (even though we finished ea... Read More
Board of Regents of the University System of Georgia by and on behalf of University of North Georgia
Guided Implementation
10/10
$37,675
20
Igor's guidance helped me to see the bigger picture of our aspirational data journey, which will allow me to better plan an estimate the total time... Read More
Sturdy Memorial Hospital
Guided Implementation
10/10
$130K
23
I only have the best parts to share, experienced and friendly staff!

Data Insights & Analytics
Put the business back in business intelligence by injecting new BI use cases.
- Course Modules: 6
- Estimated Completion Time: 1.5 hours
Build a Reporting and Analytical Insights Strategy
Deliver actionable business insights by creating a business-aligned reporting and analytics strategy.
Analyst perspective
Deliver actionable business insights by creating a business-aligned reporting and analytics strategy.

|
Self-service capabilities are recognized as the one of the top features that contribute to increased usage and adoption of business intelligence (BI) and analytics solutions. Self-service BI tools are becoming prevalent because businesses want more control over their data. This signals a move toward a more federated operating model for the BI team, as well as a focus on customers and service delivery. As a technology and data leader, your success is contingent on your ability to effectively manage the move toward a federated operating model. To support this change, you need to follow human-centered design practices and deliver the outstanding reporting and analytical insights that your customers demand. Your reporting and analytical insights strategy must support the organization’s strategy. Your strategy for reporting and analytical insights provides direction and requirements for data accumulation, augmentation, and consumption. This further paves the way for predictive analytics, market/industry intelligence, and social network analytics. Ruyi Sun |
Our understanding of the problem
|
This research is designed for:
|
This research will help you:
|
This research will also assist:
This research will help them:
|
Executive summary
|
Situation |
Complication |
Resolution |
|---|---|---|
|
Citizen data science and federated BI/insights teams are commonplace in most organizations. This shift toward federated use underlines the need to revisit your operating model type, establish roles and responsibilities for the reporting and analytical insights practices, and promote communication and alignment with the business. Data leaders want to understand the broader BI landscape and the value it can drive within the organization. |
Challenges that lead to inaccurate insights and a lack of trust in data could derail BI initiatives:
|
Drive strategy development by establishing the business context up-front to align the BI team with the most important needs of their business customers and the strategic priorities of the organization. Choose your target operating model style based on your existing BI environment and business requirements. Assess current BI maturity and determine your future-state BI maturity. Revamp or create a BI strategy to update your BI program to make it fit for purpose. |
Info-Tech Insight
Good insights generation should follow human-centered design practices. Understanding the needs and sentiments of all your customers, internal or external, is the key to creating actionable analytics insights. BI teams, whether centralized or federated, must establish and communicate the services they provide, aimed at delivering or supporting outstanding reporting and analytical insights, with their services regularly measured for effectiveness and for driving for continuous improvement.
Organizations that successfully grow their BI capabilities are reaping the rewards
Evidence is piling up: If planned well, BI contributes to the organization’s bottom line.
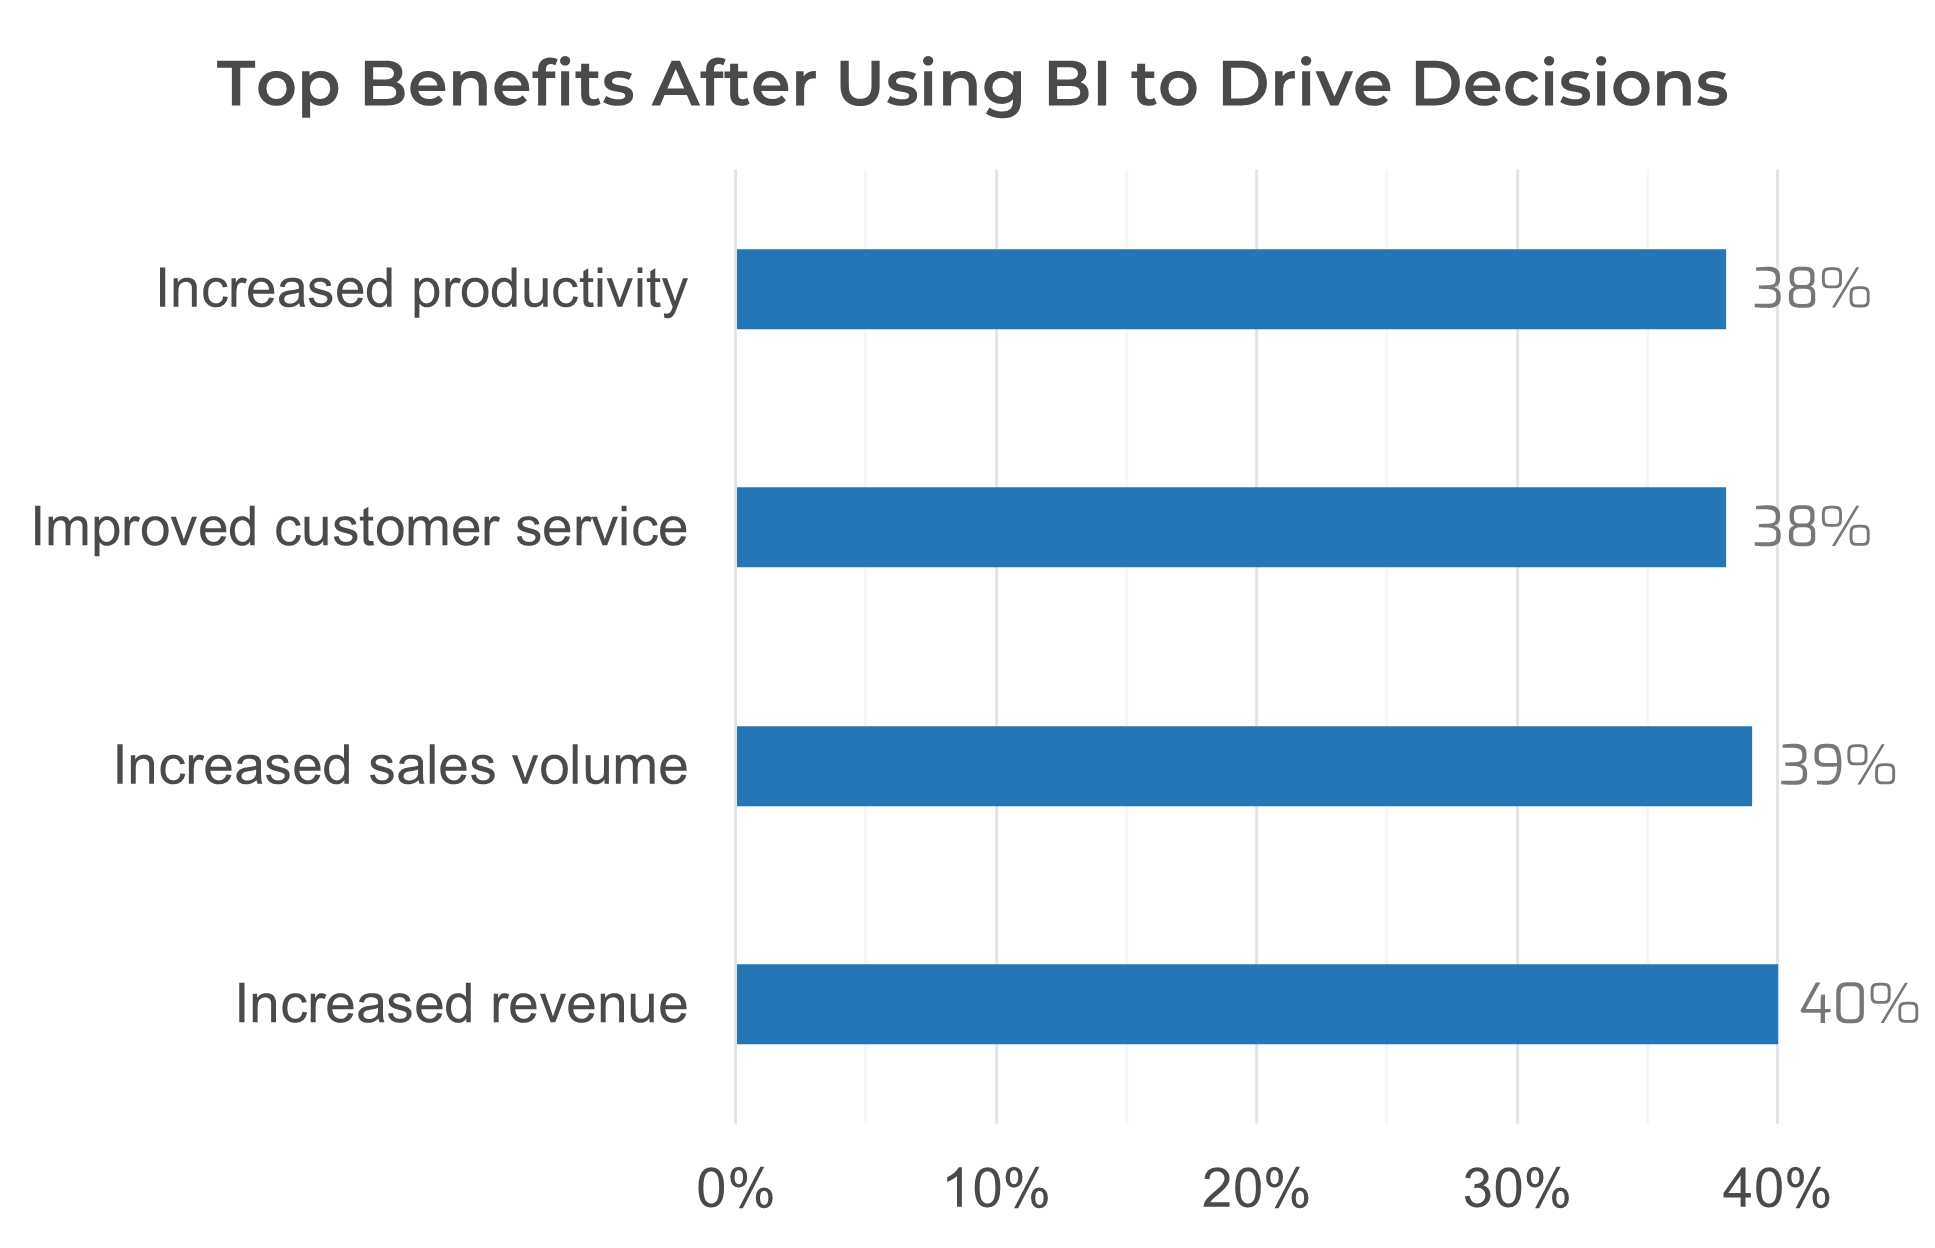
Source: Unsupervised, 2022
The global business intelligence market is estimated at US$33.3 billion in 2024, growing at a compound annual growth rate of 13.16% from 2024 to 2029
(Mordor Intelligence, 2024).
#3 priority for best-in-class companies
Best-in-class organizations differentiate themselves by prioritizing self-service analytics & data discovery, which ranks third in importance for best-in-class organizations, sixth overall, and eighth for laggards (BARC, 2023).
Reporting and analytical insights challenges
Data initiative gaps exist in organizations:
Only 32% of data available to enterprises is put to work. The remaining 68% goes unleveraged (Seagate, 2020).
87% of data science projects never make it into production (VentureBeat, 2019).
Despite ongoing interest in the field of reporting and analytical insights, few organizations manage it well:
67% of employees have access to BI tools, but many aren’t data literate enough to use them. Only 21% of employees are confident in their ability to work with data in the most impactful way (Accenture, 2020).
On average, a company uses 3.8 BI solutions. However, managing multiple BI solutions is a challenge, and 15.4% of respondents didn’t know their organization’s BI adoption rate (Wiiisdom, 2020).

Measure the value of this blueprint
Track the success factors throughout the project to keep stakeholders informed.
|
Success Factor |
Potential Metrics |
Example Target |
|---|---|---|
|
Deliver expected business outcomes |
|
|
|
Improve operational efficiency |
|
|
|
Increase end-user satisfaction |
|
|
|
Deliver BI solutions/ services on time |
|
|
Analytics maturity progression
From passive observation to action

There are three key steps to building reporting and analytical insights

1.1 Identify major business use cases
1.2 Aggregate requirements to determine
2.1 Accumulate data from data sources
What are operational reporting and self-service analytics?
Operational Reporting
Operational reporting is focused on tracking operational key performance indicators (KPIs) and providing visibility into the day-to day operations of a business. These reports are typically created using data from transactional systems such as CRM software. These reports are typically used by managers and front-line staff who need visibility into how their team or department is performing against key metrics.
Self-Service Analytics
Self-service analytics refers to the capability of individuals, typically within an organization, to independently access and derive meaningful information and insights from data without relying heavily on specialized technical assistance. It is a facet of modern BI that lets users visualize, analyze, and make decisions based on business data without relying on analysts or IT.
Info-Tech Insight
Your insights can come from self-service analytics or a central BI team, but it's also crucial to notice insights that come directly from the application landscape. Enterprise applications like Salesforce or SAP are rich sources of existing reports. Don't waste time and resources on developing reporting that already exists.
Why has self-service BI become prevalent?
Improved Productivity: Self-service BI tools improve productivity by providing easy access to data, intuitive interfaces, and quick analysis capabilities. Employees can work faster, make informed decisions based on real-time data, and reduce dependency on IT or data analysts for reports, leading to improved efficiency.
Faster, More Informed Decision-Making: Self-service BI enables faster, more informed decision-making through real-time data access, trend identification, and collaboration, expanding decision-making beyond limited individuals or departments.
Cost Reduction: Self-service BI reduces costs by minimizing the need for specialized IT or data analyst resources, eliminating the expense of hiring additional staff or relying on external contractors for data analysis tasks.
Increased Agility and Flexibility: Self-service BI enhances agility by enabling quick data access and analysis, facilitating faster responses to market changes. Customization options ensure employees have timely access to relevant data, fostering flexibility and competitive advantage.
Your business customers want more control over their data
This impacts how teams work with each other.
|
Organizations use citizen data science to democratize data, bridge skill gaps, speed up decisions, cut costs, and foster innovation. Empowering all employees to be data-savvy unlocks data’s full potential for a competitive edge. Traditionally, data tasks required skilled experts – data scientists, analysts, and statisticians. They gathered, cleaned, and analyzed data for insights. But this bottlenecked decision-making due to high demand, causing delays and missed chances. Citizen data science aims to address this limitation by enabling a broader range of individuals, including subject matter experts, business analysts, and other nontechnical professionals, to actively participate in the data analysis process. By providing accessible tools, user-friendly interfaces, and training, organizations can empower employees at all levels to work with data and extract insights relevant to their areas of expertise. By empowering employees at all levels to become data literate and proficient in data analysis, organizations can unlock the full potential of their data and gain a competitive edge in the market. |

|
When BI and self-service analytics initiatives are poorly executed, they can negatively impact organizations
Potential business impacts when BI and self-service are done badly:
- Inaccurate and unreliable insights: If data quality is compromised or data governance processes are not in place, BI and self-service analytics can result in inaccurate or unreliable insights. Decision-makers may base their actions on flawed information, leading to poor strategic decisions, operational inefficiencies, or misguided resource allocation.
- Misinterpretation of data: Without proper training or understanding of data analysis techniques, users may misinterpret the data they are working with. This can lead to incorrect conclusions, flawed correlations, or misleading visualizations.
- Data silos and fragmentation: BI and self-service analytics initiatives may lead to the creation of data silos and fragmented analysis. Different teams or individuals may use different tools, data sets, or methodologies, resulting in inconsistent and disconnected analysis across the organization.
- Overwhelming complexity: BI tools often provide users with a wide range of capabilities and functionalities. Without proper guidance or training, users may feel overwhelmed by the complexity of the tools or struggle to navigate the vast amount of data available.
To mitigate these potential negative impacts, organizations should invest in proper data governance, establish clear guidelines and training programs for users, ensure data quality and security measures are in place, and promote collaboration and standardization in self-service analytics initiatives. Effective communication, support, and monitoring are key to ensuring that BI and self-service analytics initiatives deliver accurate, reliable, and actionable insights for the organization.
Reporting and analytical insights do not operate in isolation
Challenges exist outside your program. Be aware of their impact and interdependency.
|
Lack of governance |
Poor data quality |
Data privacy and security risks |
Inadequate training |
|---|---|---|---|
|
Insufficient policies and procedures for data management, including data quality and metadata management, can lead to data inconsistencies and erode trust in decision-making. Enhance trust and consistency in self-service BI through governance. Clear ownership of data by individuals or departments ensures accountability and consistency, while organization-wide data governance policies drive improved data accuracy, consistency, and security. |
Poor data quality in BI can lead to inaccurate insights, wasted resources, lack of trust, inefficient processes, compliance risks, missed opportunities, and poor customer experience. Mitigating these problems requires prioritizing data quality management through data governance, quality controls, validation, and cleansing processes. |
Self-service BI tools can increase the risk of data breaches if they are not properly secured. Organizations must apply appropriate safeguards and controls to protect data and ensure compliance with data privacy regulations. |
Even though self-service BI provides ease of use, don’t overlook training. Inadequate user training can result in low adoption rates, inaccurate insights and analysis, increased IT workload, and privacy and security problems. |
The benefits of your initiatives are not just about technology
|
Informed Decision-Making |
Well-executed BI and self-service analytics empower decision-makers with accurate, timely, and relevant insights. By providing access to real-time data and intuitive analytics tools, organizations can make informed decisions based on data-driven insights. This leads to improved strategic planning, better resource allocation, and increased operational efficiency. |
|---|---|
|
Agility and Responsiveness |
BI and self-service analytics enable organizations to quickly respond to changing market conditions and emerging opportunities. With self-service capabilities, business users can independently explore and analyze data, reducing dependency on IT or data teams. This agility allows organizations to adapt their strategies and operations in a timely manner, gaining a competitive edge. |
|
Enhanced Productivity and Efficiency |
Self-service analytics empowers business users to access and analyze data without relying on technical experts. This reduces the burden on IT or data teams, freeing up their time for more strategic initiatives. Self-service analytics tools also streamline workflows, automate repetitive tasks, and provide intuitive interfaces, resulting in improved productivity and efficiency across the organization. |
|
Data Democratization and Collaboration |
Well-executed BI and self-service analytics initiatives promote data democratization by making data accessible to a broader range of users. This fosters a collaborative environment where individuals from different departments can explore and share insights, leading to cross-functional collaboration, innovation, and a more holistic understanding of the business. |
|
Improved Operational Performance |
By leveraging BI and self-service analytics, organizations can identify operational inefficiencies, bottlenecks, and areas for improvement. Data-driven insights enable process optimization, resource allocation refinement, and better operational decision-making. This leads to streamlined operations, reduced costs, and enhanced overall performance. |
Insight summary
Overarching insight
Good insights generation should follow human-centered design practices. Understanding the needs and sentiments of all your customers, internal or external, is the key to creating actionable analytics insights. BI teams, whether centralized or federated, must establish and communicate the services they provide, aimed at delivering or supporting outstanding reporting and analytical insights, with their services regularly measured for effectiveness and for driving for continuous improvement.
Insight 1
A business analyst or business intelligence analyst is typically one of the first hires and the most outward-facing member of the team, acting as a bridge between the BI team and other business stakeholders. A successful BI team necessitates investment in business analysis skills.
Insight 2
The BI operations and services components enable programmatic development of outstanding reporting and analytical insights. These components guide organizations’ plan for success. Without proper setup for stakeholder engagement, performance measurement, etc., the BI program is likely to fail.
Insight 3
Assessing current and target states is only the beginning. The real value comes from the interpretation and analysis of the results. Use visualizations of multiple viewpoints and discuss the results in groups to come up with the most effective ideas for your strategy and roadmap.
Tactical insight
Your insights can come from self-service analytics or a central BI team, but it's also crucial to notice insights that come directly from the application landscape. Enterprise applications like Salesforce or SAP are rich sources of existing reports. Don't waste time and resources on developing reporting that already exists.
Tactical insight
The BI team does not typically own the responsibility for solving problems in data management disciplines, but it's important to understand their interdependence and impact on the BI program. For example, if your data is of poor quality, the reports will not offer valuable insights even if they are well constructed.
Blueprint deliverables
Each step of this blueprint is accompanied by supporting deliverables to help you accomplish your goals:

|

|
|
BI User Perception Survey Collect and analyze BI end-user perception and satisfaction. |
BI Practice Assessment Tool Evaluate the current and target performance levels for your organization’s BI practice. Populate your Gantt chart to visually represent your key initiative plan. |
Key deliverable:
BI Strategy and Roadmap Presentation Template
Present this presentation to ensure the business is aligned with the formulated strategy and roadmap and to generate interest in your BI program.

Info-Tech’s methodology for building a reporting and analytical insights strategy
|
1. Align Organizational Strategy With Reporting & Analytical Insights Strategy |
2. Choose Your Operating Model Style |
3. Evaluate BI Practice Maturity |
4. Create a BI Strategy and Roadmap |
|
|---|---|---|---|---|
|
Phase Steps |
|
|
|
|
|
Phase Outcomes |
|
|
|
|
Info-Tech offers various levels of support to best suit your needs
DIY Toolkit
Our team has already made this critical project a priority, and we have the time and capability, but some guidance along the way would be helpful.
Guided Implementation
Our team knows that we need to fix a process, but we need assistance to determine where to focus. Some check-ins along the way would help keep us on track.
Workshop
We need to hit the ground running and get this project kicked off immediately. Our team has the ability to take this over once we get a framework and strategy in place.
Consulting
Our team does not have the time or the knowledge to take this project on. We need assistance through the entirety of this project.”
Diagnostics and consistent frameworks used throughout all four options
On Demand
Webinar
Build a Reporting and Analytics Strategy
Play Webinar
About Info-Tech
Info-Tech Research Group is the world’s fastest-growing information technology research and advisory company, proudly serving over 30,000 IT professionals.
We produce unbiased and highly relevant research to help CIOs and IT leaders make strategic, timely, and well-informed decisions. We partner closely with IT teams to provide everything they need, from actionable tools to analyst guidance, ensuring they deliver measurable results for their organizations.
What Is a Blueprint?
A blueprint is designed to be a roadmap, containing a methodology and the tools and templates you need to solve your IT problems.
Each blueprint can be accompanied by a Guided Implementation that provides you access to our world-class analysts to help you get through the project.
Need Extra Help?
Speak With An Analyst
Get the help you need in this 4-phase advisory process. You'll receive 10 touchpoints with our researchers, all included in your membership.
Guided Implementation 1: Align organizational strategy with reporting & analytical insights strategy
- Call 1: Review business context, identifying organizational drivers, challenges, pain points, enablers, and inhibitors.
- Call 2: Analyze user sentiment feedback.
- Call 3: Review critical BI artifacts and understand the usage of your existing BI.
- Call 4: Discuss high-level business requirements gathering.
Guided Implementation 2: Choose your operating model style
- Call 1: Review different operating model types and select target operating model type.
- Call 2: Discuss BI operations and services key components.
Guided Implementation 3: Evaluate BI practice maturity
- Call 1: Measure the BI current-state maturity.
- Call 2: Determine the BI target-state maturity and perform a gap analysis.
Guided Implementation 4: Create a BI strategy and roadmap
- Call 1: Discuss initiative building.
- Call 2: Review completed roadmap and next steps.
Contributors
- Albert Hui, Principal, DataEconomist
- Cameran Hetrick, Senior Director of Data Science & Analytics, thredUP
- David Farrar, Director – Marketing Planning & Operations, Ricoh Canada Inc.
- Emilie Harrington, Manager of Analytics Operations Development, Lowe’s
- Sharon Blanton, VP and CIO, The College of New Jersey
- Raul Vomisescu, Independent Consultant
 Build Your AI Solution Selection Criteria
 Build a Reporting and Analytical Insights Strategy
 Establish Data Governance
 Business Intelligence and Analytics Platform Selection Guide
 Mitigate Machine Bias
 Get Started With Artificial Intelligence
 Define the Components of Your AI Architecture
 Drive Business Value With Off-the-Shelf AI
 Govern the Use of AI Responsibly With a Fit-for-Purpose Structure
 AI Trends 2023
 Data and Analytics Trends 2023
 Build Your Generative AI Roadmap
 Tell Your Story With Data Visualization
 Select Your Generative AI Vendor
 An AI Primer for Business Leaders
 Identify and Select Pilot AI Use Cases
 Design Your AI Target Operating Model
 Plan Your Early AI Moves: Training for Business Leaders
 Build Your AI Business Case
 Run IT By the Numbers
 Transform IT, Transform Everything
 The Race to Develop Talent
 Assessing the AI Ecosystem
 Sync or Sink: Aligning IT and HR for the Future of Work
 Bring AI Out of the Shadows
 The AI Vendor Landscape in IT
 IT Spend and Staffing Benchmarking
 The Data Playbook
 Assess Your Data Science and Machine Learning Capabilities